Answer:
Option A
Explanation:
From thermodynamics,
$ln k=\frac{-\triangle H^{o}}{RT}+\frac{\triangle S^{o}}{R}$ ......(i)
Mathematically, the equation of straight line is
$y-c+mx$ .....(ii)
After comparing Eq. (ii) with (i) we get,
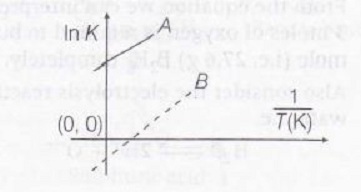
slope= $\frac{\triangle H^{o}}{R}$ and intercept= $\frac{\triangle S^{o}}{R}$
Now, we know for exothermic reaction $\triangle H$ is negative(-)ve. But here,
Slope = $\frac{\triangle H^{o}}{R}$ is postive
So, lines A and B in the graph represent temperature dependence of equilibrium constant K for an exothermic reaction as shown below
