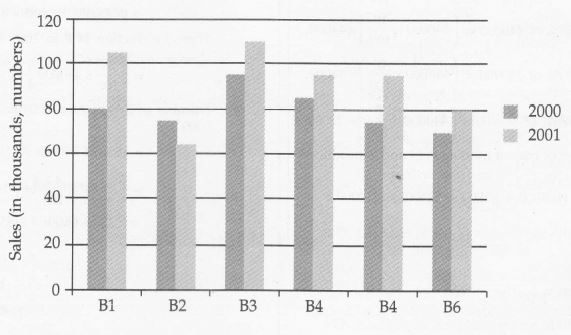
Direction: The bar graph given below shows the sales of books (in thousand number from six branches of a publishing company during two consecutive years 2000 and 2001. Sales of books (in thousands numbers) from six branches B1, B2, B3, B4, B5 and B6 of a publishing company in 2000 and 2001,
1722021740_bargraph 16.JPG

1)

What is the average sales of all the branches (in thousands numbers) for the years 2000?


A) 73

B) 80

C) 83

D) 85

Answer:

Option B

Explanation:

Total sales of all the six branches (in thousand numbers) for the year 2000

= 80 + 75 + 95 + 85 + 75 + 70 = 480 

Average sales of all the six branches (in thousand numbers) for the year 2000

= $\frac{480}{8}$ = 80